Building a Pokedex in React
What I learned about responsive web design, APIs, and new libraries

Blog post by Jordan Riesel — Published at 11/2/2022, 7:20:19 AM
Introduction
My earliest Christmas memory dates back over 20 years when I received a teal GameBoy Color and a copy of Pokemon Gold from my grandparents. In the over two decades since that day, I’ve caught thousands of Pokemon across the dozens of games, collected (and often lost) the trading cards, and bonded with friends over a mutual enjoyment of the franchise. When deciding which topic to pursue a new project to learn React (and HTML, JavaScript, and CSS) with, this “old reliable” was an obvious choice.
My Pokedex application is a web app that allows users to look through the original 151 Pokemon and learn their types, stats, and even a short blurb about them. I built the application to have two distinct experiences— a small mobile device view with a “stacked” interface and a large-screen “split” interface to use the greater viewport width. Also, I employed the library “Chart.JS” to dynamically visualize the six primary stats every Pokemon possesses.
The Concepts

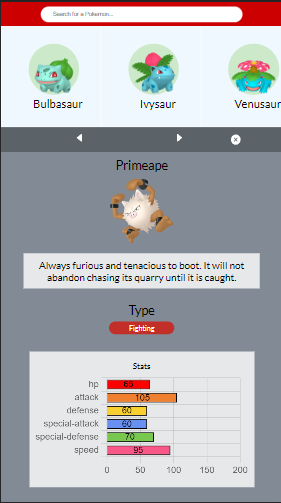
In this view, vertically-aligned elements allow a more compact view, and the user can scroll across the library of cards at the top.
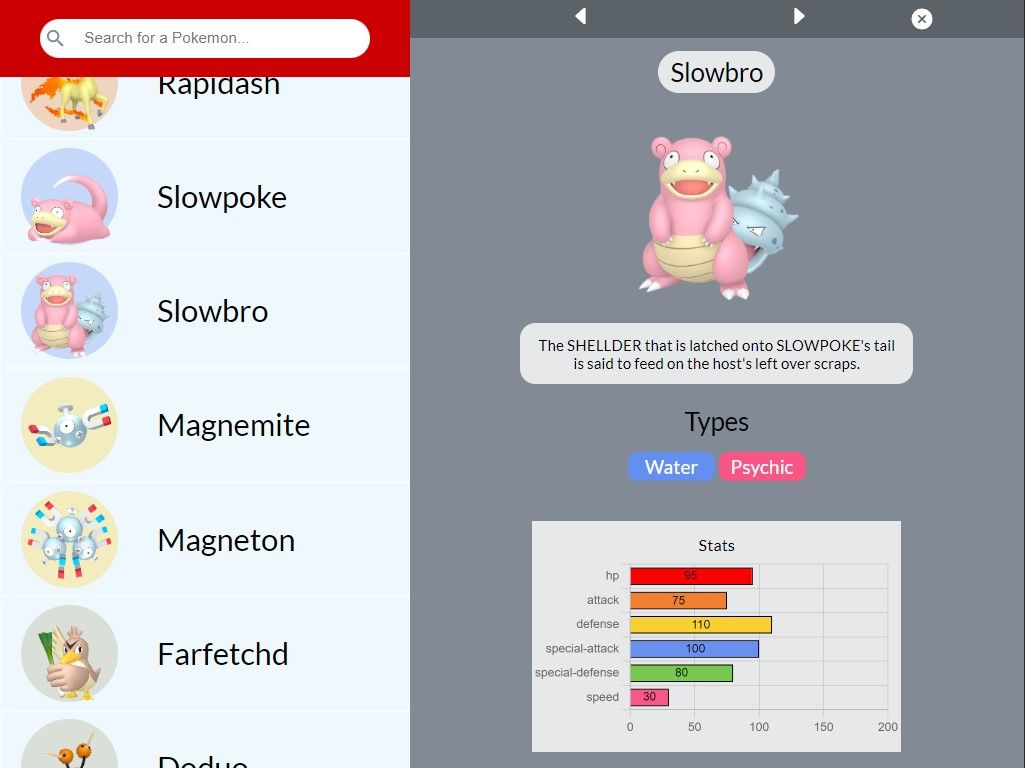
I designed the application to have two main elements— the browsing view that includes the search filter, the clickable cards, and the cards’ host container, and the detail view containing all of the Pokemon’s information. With this setup, a width-wise or vertically-stacked arrangement is only the difference in flex-direction. Media queries allow finer tuning for elements that need to be wider or narrower to use the available space better.
Data visualizations have been a cornerstone of my Python experience, but Chart.JS is my first foray into JavaScript visualization. I found the library very easy to use, only requiring a small amount of data formatting to ensure compatibility.

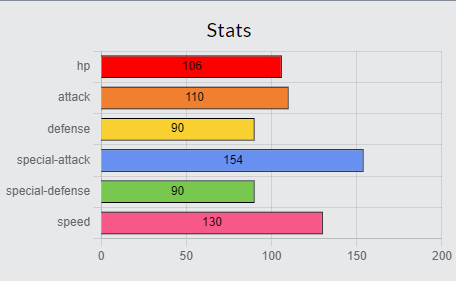
Mewtwo’s incredibly high Special Attack and Speed are rendered quickly, even when jumping from Caterpie’s significantly lower totals.
Chart.JS, when married with React’s UseEffect hook, can handle changes between Pokemon (precisely, the changes in data to be rendered). In this application, I use two separate UseEffect functions within the “StatChart” component to manage the data formatting and the following chart render. Splitting the effects into different functions prevented data lag where the chart reflected a previous state rather than the currently selected Pokemon.
Conclusions
This project was an engaging way to learn more about making a functional application through a topic friends (and even family) find accessible. Creating two robust and distinct user experiences through media queries was a compelling experience that demanded some new concepts in CSS. Coming from a background in data science with Python, data visualization with Chart.JS was a retreading through familiar territory but with a new vehicle to achieve similar goals. I only explored bar charts in this app, but Chart.JS certainly possesses even more tools I will employ in future projects.
You can find my application at this GitHub Pages site and all of the source code is available to view in this repository. I strongly encourage checking out the application on both desktop and mobile to see both experiences!

